Nuclear magnetic resonance
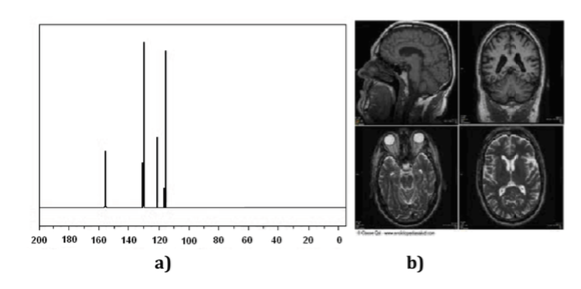
Nuclear Magnetic Resonance (NMR) techniques are an indispensable instrument for chemistry as well as for other branches of Science. With NMR spectroscopy one can identify molecules (Figure a spectrum), determine their structure or study dynamic processes. For example, it has been key in determining the structure of proteins in solution and, on the other hand, NMR imaging techniques are an indispensable tool in medical diagnosis, as illustrated in (Figure b).
NMR is based on three elements:
a) The magnetic character of the nuclei of the molecules under study:
Many atomic nuclei, due to nuclear spin, have magnetic characteristics. In a certain way it can be considered that the nuclei behave like small magnets.
b) The application of an intense magnetic field:
When the molecules under study are immersed in a magnetic field, the nuclear levels unfold into various energy levels. Each of the energy levels that appear correspond to different orientations of the spins of the nuclei (small magnets) with respect to the magnetic field.
c) Illumination of the sample with electromagnetic radiation:
As in other spectroscopic techniques, the illumination of the sample with the adequate frequency of radiation will cause the nuclei to pass from one level to another. The frequency of the radiation necessary to produce this jump in level will depend on the type of nucleus, its chemical environment, the type of nuclei present in its vicinity, and the applied external field. Throughout this topic, the physical foundations of this technique will be studied, and the experimental techniques that allow obtaining the spectra will be explained, also analyzing the causes that make the spectra of the various molecules different.
Basics of NMR:
Nuclear spin and angular momentum of nuclear spin
Atomic nuclei are made up of protons and neutrons. Both nucleons have orbital angular momentum and spin angular momentum (both protons and neutrons have spin 1/2). The resultant of the vector sum of all the moments (orbital and spin) of all the protons and neutrons of the nucleus gives as a result the nuclear spin angular momentum and is symbolized by I and its units are J s. According to quantum mechanics, the magnitude of the nuclear spin angular momentum, |I|, is quantized, with a value I(I+1)h where I is the nuclear spin quantum number or nuclear spin and ħ is h/2p(which in the international system it is worth 1.05457·10-34J·s). The value of I is a fixed characteristic of each type of atomic nucleus and can take an integer or semi-integer value (0,1, 2, 3,… ½ , 3/2 , 5/2…).
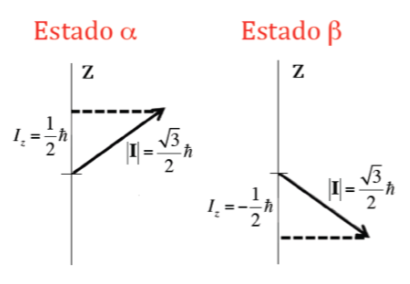
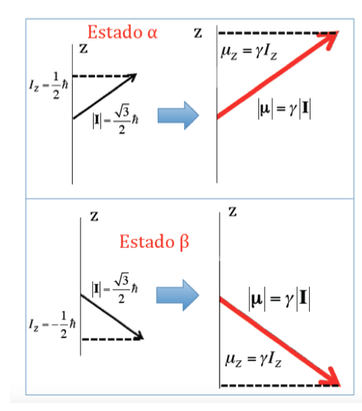
In addition to the modulus, it is also important to know the component of angular momentum about the z axis, Iz. This can also take quantized values given by the expression m I h where m I is the quantum number associated with the z component of the nuclear spin angular momentum and that can take the following values: –I, (‐I+1) , ... , (I-1), I. Thus, for a given nucleus, with a value of I, there are (2I+1) orientations of the angular momentum of nuclear spin. For example, consider the atomic nucleus of the most common isotope of the hydrogen atom, 1H, which is formed by a proton and it is known that its nuclear spin, I , is 1/2, and therefore m I can take two values +1 /2 and ‐1/2 (in NMR the 1H isotope is often referred to as a proton). The proton therefore has two possible nuclear states, one called a with m I =+1/2 and the other b with m I =‐1/2. The Figure below shows the two possible orientations of the nuclear spin angular momentum corresponding to states a and b, which are energetically equivalent.
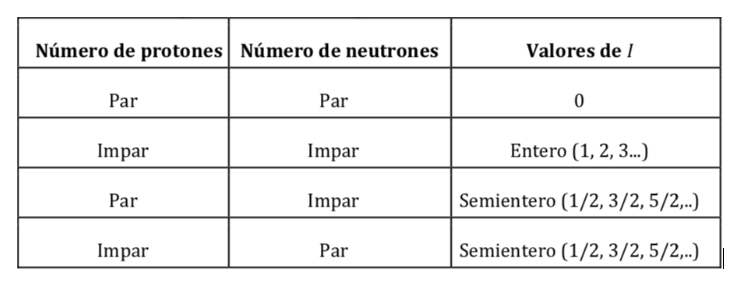
Values of I according to the number of protons and neutrons in the nucleus:
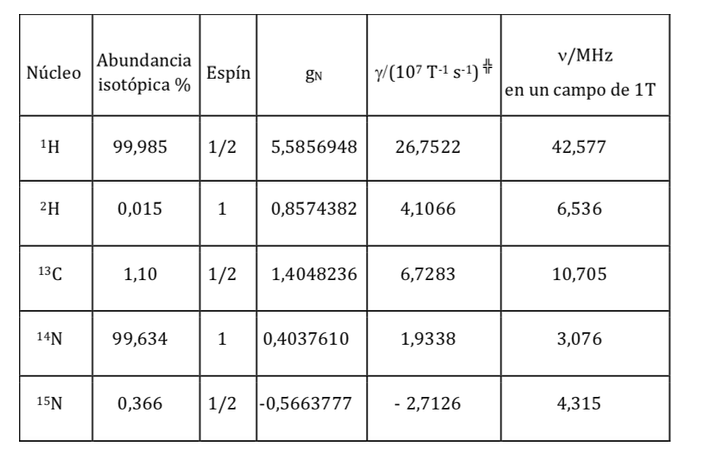
Magnetic properties of various nuclei:
Nuclear magnetic dipole moment (nuclear magneton, gyromagnetic ratio):
Just as the electron has a magnetic dipole moment, some, but not all, atomic nuclei have a magnetic dipole moment. As indicated, the nuclei behave like small magnets, the origin of this magnetic character being the angular momentum of the nuclear spin. The nuclear spin angular momentum, I, gives rise to a nuclear magnetic dipole moment mI which is given by:
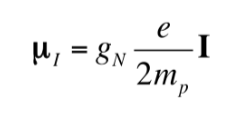
where gN is the nuclear g factor. Note that this expression uses the mass and charge of the proton (mp ye) by definition, instead of the mass and charge of the nucleus in question. The differences from one nucleus to another are included in the nuclear gN factor. The value of gN cannot be obtained theoretically, so it is determined experimentally. The units of mI are JT-1
The relationship between mI and I can also be expressed as follows:

with

being a constant with a value of 5,050 10-27J T-1 called nuclear magneton and g is the gyromagnetic relationship (T-1s-1). In the previous tables values of these magnitudes were already shown for some isotopes. Although in most cases mI and I have the same sense, sometimes it is opposite, as can be deduced from the negative values of the factor gN and g for the 15N isotope, for example.
In the case of the proton where two possible orientations of the angular momentum had been seen, there will be two possible orientations of the dipole magnetic moment, as illustrated in the following figure, both orientations being energetically equivalent, since the choice of a z direction is arbitrary.
Energy of interaction of the magnetic field with the nuclear magnetic moment:
If a molecule is introduced into a magnetic field, with flux density or magnetic field B, the dipole magnetic moment of each of its nuclei will interact with it, as illustrated in the following figure, the energy of the interaction being expressed by :
![]()
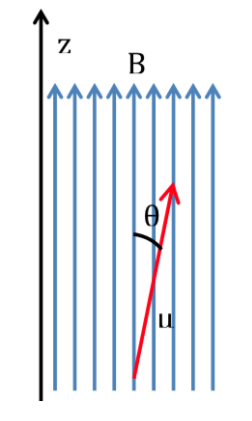
According to classical physics, all orientations of a magnetic dipole within a magnetic field are allowed and therefore q can take any value between 0 and 180o. Depending on the orientation of the dipole, the energy will be higher or lower:
The most favorable interaction occurs when both magnitudes have the same direction: q=0 and therefore cos q=1 and :

However, according to quantum mechanics, not all orientations of the nuclear magnetic dipole are allowed, the orientations are quantized and only certain values of q are possible. There are as many orientations allowed as Iz or mI values (‐I, ‐I+1,..., I‐1, I) that is, 2I+1 orientations. Obviously the number of orientations of the dipole moment varies with the type of atomic nucleus. In order to define the orientations, the direction and direction of field B is taken as a reference for the Z axis.
Thus the interaction energy of the external magnetic field B and the nuclear dipole will be given by: j
Langmor frequency
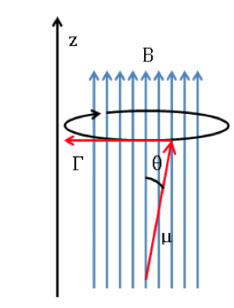
If an external magnetic field of intensity B acts on the nucleus, the nuclear magnetic dipole experiences a couple of forces as shown in the following formula given by:

which tends to align the dipole with the magnetic field. As the magnetic dipole cannot be aligned with the magnetic field, the system is unable to dissipate this energy and precesses, called the Larmor precession, in
about the direction of the applied field. The frequency of this precession is called the Larmor frequency, with a value:
langmor schematic:
NMR spectroscopy
The key to any spectroscopic technique is based on the possibility that the molecule under study may be at more than one energy level, in such a way that by making electromagnetic radiation (rem) of the appropriate frequency affect it, it can pass into our system. (molecule) from one energy level to another. As seen in the previous section, the nucleus of a proton, immersed in a magnetic field, can occupy two different levels associated with nuclear spin, thus making a rem beam of the appropriate frequency fall on a 1H nucleus that is occupying the lower level, it can be passed to the upper level. This type of transitions is what gives rise to Nuclear Magnetic Resonance Spectroscopy (NMR). From now on we will focus on the case of the 1H proton, as it is the most used spectroscopy, although everything indicated is applicable to other nuclei. In fact, more and more variety of cores are used.
Resonant frequency:
The frequency that causes the transition is obtained by applying the resonance condition:

As the energy difference between two consecutive levels is:

equating both expressions and isolating n:

which, as can be seen, coincides with the Larmor precession frequency.
Proton NMR resonance frequencies for various field strengths:

Selection rules:
The selection rules that were studied in other spectroscopies correspond to the interaction of the electric dipole with the electric field of the radiation. On the other hand, in NMR the interaction occurs between the magnetic dipole of the nucleus and the variable magnetic field of the radiation. To determine the selection rules, the general expression that determines the probability of passage between two states must be remembered:

The Hamiltonian, in this case, is the product of the operator of the oscillating magnetic field of the radiation by the operator of the dipole moment of the nucleus.
![]()
It can be shown that for there to be a transition between two levels the corresponding selection rule is:
m I = ± 1
Signal strength (population levels):
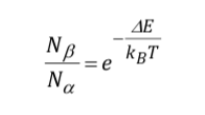
The signal intensity is directly related to the population of levels involved in the transition. According to Boltzman's law of distribution, for a two-level system, such as the proton, the ratio of the population of the upper level, Nb, and the population of the lower level, Na, is given by:
Description of NMR equipment:
What experimental procedure is used to obtain the spectrum? Generally in spectroscopy the frequency of the incident radiation is varied, until absorption is observed. However, in NMR spectroscopy there is also the option of keeping the radiation frequency fixed and varying the spacing between the levels, varying the magnitude of the applied field B until absorption is observed. In the following figure where a scheme of an NMR equipment is presented. The sample is placed in a tube, which is sometimes rotated quickly to gain homogenization in the signal, although the use of rotation is currently under discussion, since it can introduce errors. The tube, in turn, is located between two magnetic poles that are the ones that generate the magnetic field. There is a transmitter and a receiver of radio frequency. The emitter signal can be controlled to do a frequency sweep. With sweep coils one sweep of the field can be controlled. Current NMR equipment almost no longer uses:
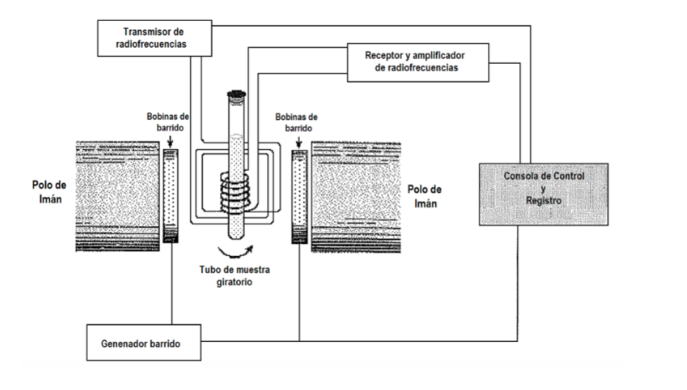
previous procedures, but are based on the use of Fourier transform techniques. B is held stationary and the sample is illuminated with a high-power, time-limited radio frequency pulse with frequency nrad, a fixed value in the NMR frequency range of the nucleus type being studied. The pulse lasts several microseconds, so it can be shown mathematically by a technique called Fourier analysis that the radio frequency pulse is equivalent to a range of frequencies ∆n around nrad and excites all possible NMR resonances. The signal observed in the detector will contain all resonant frequencies and is analyzed by a computer using Fourier transform techniques. This procedure allows very high resolution and work with nuclei that with the previous procedures had very weak signals.
Nuclear shielding:
In Magnetic resonance, nuclei with spin angular momentum other than zero are used, such as 1H and 13C. However, the resonance frequencies are not the same for all hydrogen or carbon nuclei, they depend on the chemical environment that surrounds each nucleus. This is due to the fact that the electrons that surround each nucleus generate a magnetic field that opposes the applied one, it is said that the nuclei are shielded, where σ is the shielding constant.

Bef is the net magnetic field acting on the proton; B0 is the applied magnetic field; σ is the shielding constant, independent of the applied field. Under this new situation, with the nuclei shielded by the electronic density that surrounds them, the resonant frequency becomes

Nuclei with different chemical environments have a different screening constant, generating different signals in the NMR spectrum.
ethanol spectrum:
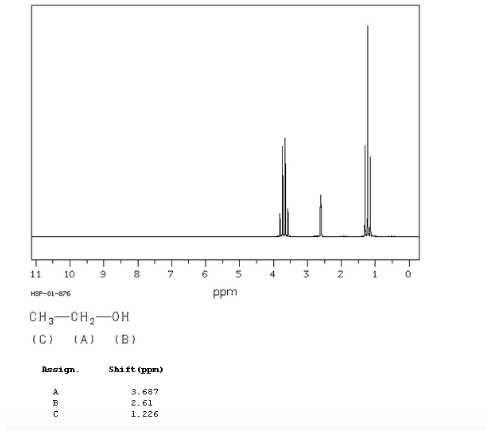
In the NMR spectrum of ethanol, three different signals are observed, due to the existence of 3 types of hydrogens with different chemical environments. Hydrogens A are more unshielded than C due to the presence of oxygen (electronegative atom that removes electron density). The chemical environment of hydrogen B, directly attached to oxygen, is also different, resonating at a different frequency from the previous ones.
chemical shift
Signals in the NMR spectrum are measured on a scale independent of the applied magnetic field, called the chemical shift and represented by the letter δ. Regardless of the magnetic field at which the spectrophotometer works, the signals of a chemical compound are always obtained at the same values of δ:

Displacement table:
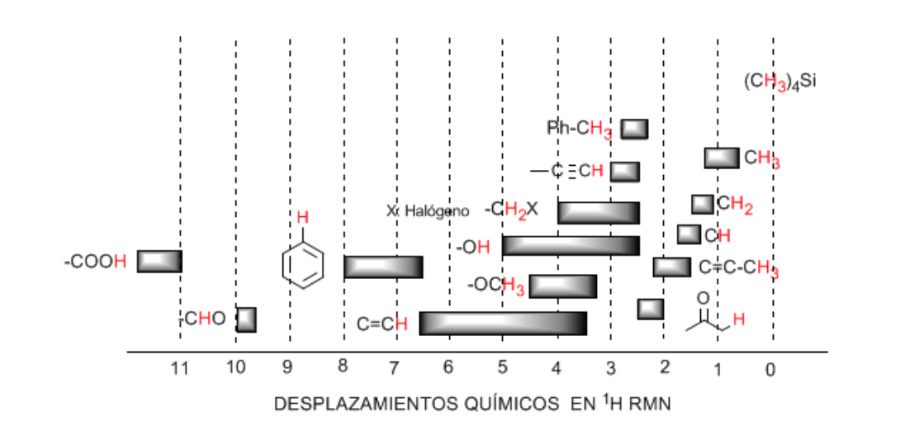
Hydrogens located on aliphatic chains present δ values close to 1. This increases slightly when going from primary to secondary or tertiary carbons.
The allylic hydrogens are located between 1.5 and 2.1.
Alpha hydrogens with respect to carbonyls and acid derivatives are between 2 and 2.5.
The benzylic hydrogens between 2.3 and 2.7.
The hydrogen of terminal alkynes between 2.5 and 3.
Hydrogens attached to carbons with halogens between 2.5 and 4 depending on the electronegativity of the halogen
The hydrogens of the hydroxyl group between 2.5 and 5. Very wide range due to the formation of hydrogen bonds.
Carbon hydrogens attached to ether type oxygen between 3.3 and 4.5.
Olefinic hydrogens between 3.5 and 6.5.
Hydrogens bound to aromatic systems between 6.5 and 8.
Aldehyde hydrogen 9.5-10
Hydrogen from the carboxylic acid group above 11.
The electronegative groups deshield the nuclei:
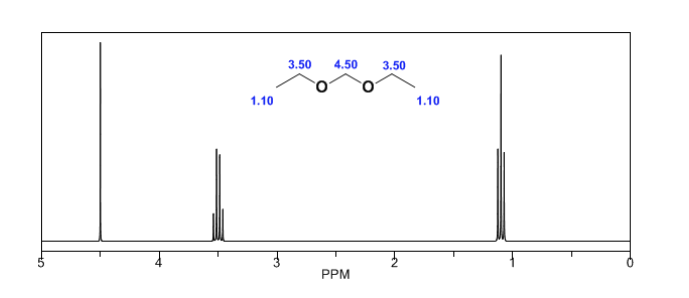
Electronegative substituents remove electron density, unshielding the hydrogens, and shift the signal toward high δ values.
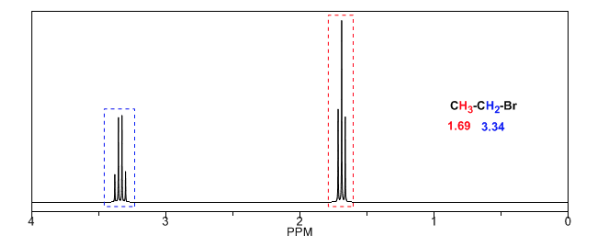
In the following table you can see the influence of different atoms on the signal of the methyl hydrogens.

In the following spectra, the aforementioned effects on chemical shifts can be observed.
Magnetic anisotropy:
The protons close to double bonds and aromatic rings are especially unshielded due to the magnetic field induced by the electronic currents of these systems. The induced field is added to the applied one, producing a displacement greater than expected.
In the following image we can see the electronic circulation (curves in bold) and the induced magnetic field (dashed lines) for an alkene and a carbonyl. Observe how in the region of the proton the induced magnetic field has the same direction and direction as the applied one.
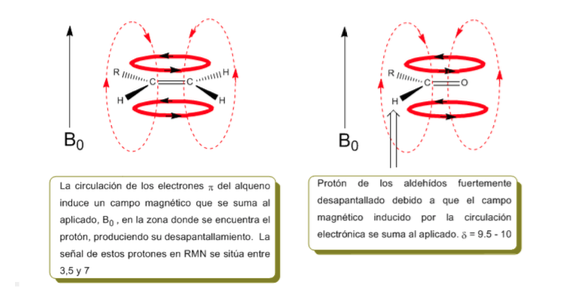
A similar situation is observed in the case of benzene. However, in alkynes, electronic circulation induces a magnetic field that opposes the one applied in the proton area. The acetylenic hydrogens are shielded with signals in the NMR spectrum at low offsets.
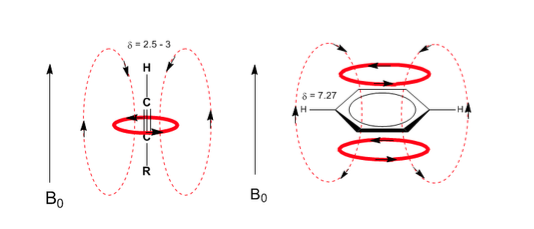
Observe how the induced fields considerably increase the displacements of the olefinic proton, the allylic positions being also affected.
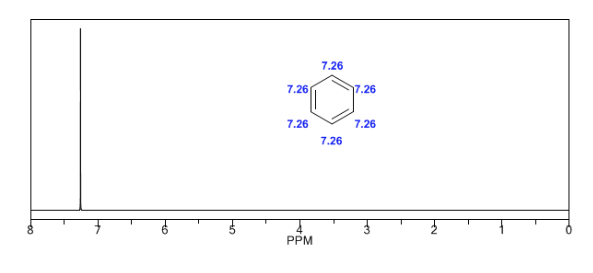
The aromatic hydrogens are strongly unshielded due to the field induced by the ring currents.
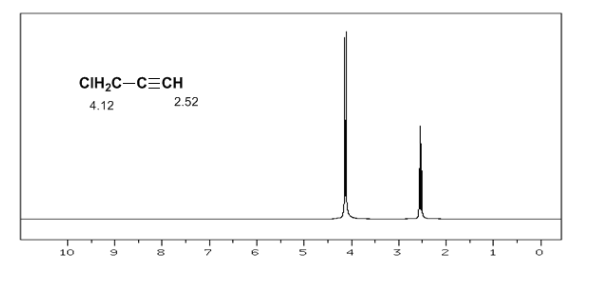
The acetylenic hydrogen has a low displacement, because the currents produce a magnetic field that opposes the applied one.
The most common acidic hydrogen shifts in organic molecules are:
- ·Carboxylic acids (RCOOH) δ= 10 - 12 ppm
- ·Amines (R−NH2) δ= 0.5 - 5 ppm
- Amides (RCONH2) δ= 5-8 ppm
- ·Alcohols (ROH) δ= 0.5 - 5 ppm
- Phenols (Ph-OH) δ= 4 - 7 ppm
Spin-spin coupling:
The structural information of NMR derives from two factors: the different displacements observed depending on the chemical environment that surrounds the proton and the coupling between the spins of nearby protons, which produces the splitting of the signals.
Although some signals in the spectrum are single peaks, it is common to find signals composed of several very close peaks, which are named with the following notation: singlet (s), doublet (d), triplet (t), quadruplet (c), quintuplet ( q), sextuplet (sx) and septuplet (sp), complex signals are designated as multiplets. The value of δ of these signals is assigned to their center, unless the multiplet is irregular, in which case the interval is indicated.
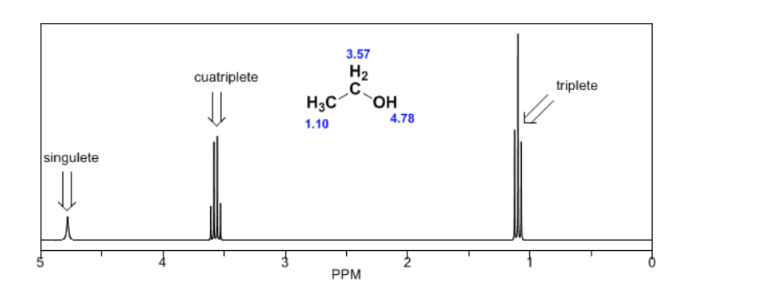
In the spectrum of ethanol it can be seen that the hydroxyl hydrogen produces a singlet, the pair of hydrogens on carbon one give rise to a quadruplet, and the three hydrogens on carbon two produce a triplet.
Explanation of spin-spin coupling.
To understand the splitting of signals due to spin-spin coupling we are going to study the spectrum of 1,1-dichloro-2,2-diphenylethane ( Cl 2 CH a CH b Ph 2 ).
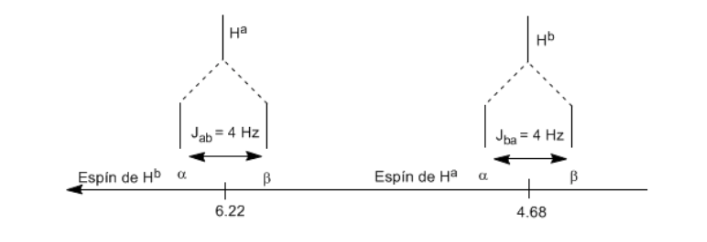
The proton Ha subjected to a magnetic field B0 produces a signal at δa=6.22ppm. However, the Hb proton generates a small magnetic field that affects the Ha proton. Approximately half of the molecules have the Hb proton aligned with the applied field (alpha spin) and the other half have it oriented against the field (beta spin). ). When Hb has spin α, Ha is subjected to a slightly larger field and resonates at a higher frequency (slightly higher δ). When Hb has β spin, Ha is subjected to a slightly smaller field and resonates at a lower frequency (slightly lower δ), which splits the initial peak into two signals separated by a distance of 4 Hz, called the coupling constant ( J). This same reasoning can be done for the Hb proton.
Lastly, we will discuss the coupling of a proton with three equivalent neighboring protons. In this case, a signal made up of four peaks (quadtriplet) is observed. The central peaks are three times as intense as the extreme peaks.
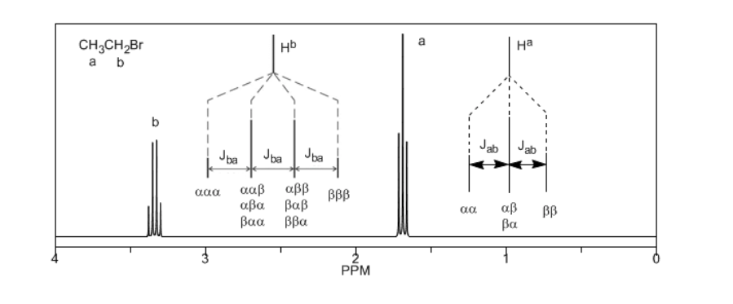
Rule N+1
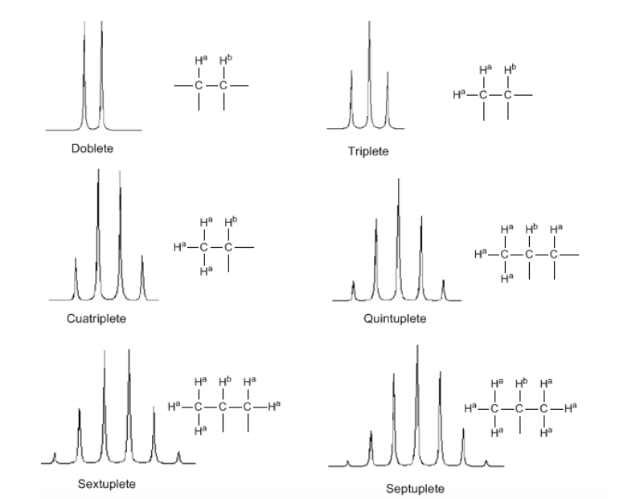
From the above discussion it can be deduced that a proton produces a signal with a number of peaks one unit greater than the number of neighboring hydrogens. In the following image we can see the peaks produced by an Hb hydrogen when coupled with a number of variable hydrogens
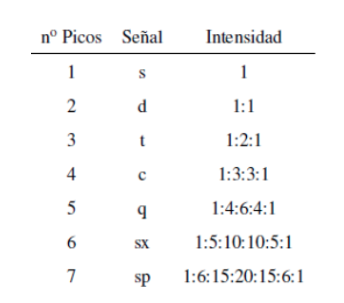
The intensity of the peaks of a signal are given by Pascal's triangle (Tartaglia):
Two considerations must be taken into account when applying the N+1 rule:
- In molecules of the type A−CHa2−CHb2−CHa2−A the Hb protons appear as a quintuplet.
- In molecules of the type A−CH2−CH2−A, the four protons are equivalent and give a singlet.
Coupling of three non-equivalent nuclei:
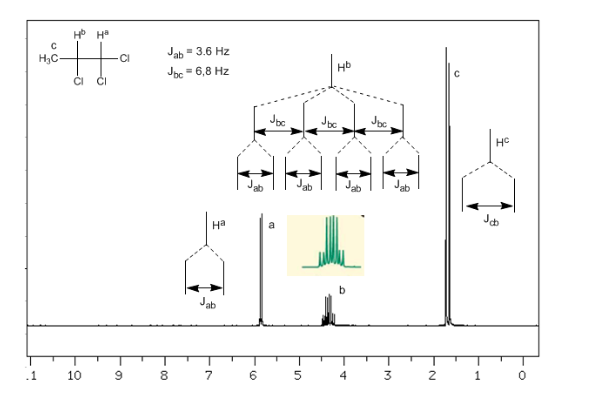
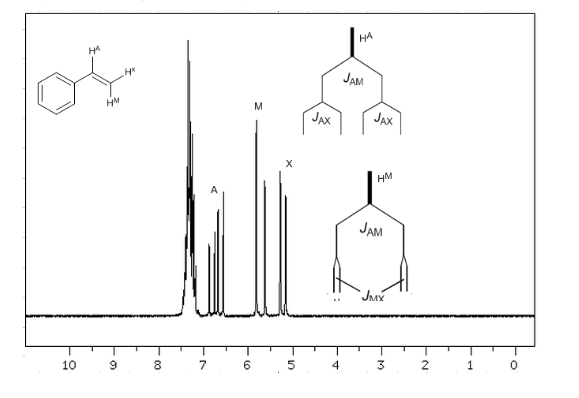
Taking into account that the order of coupling constants in alkenes is Jtrans>Jcis>Jgeminal, the coupling trees for the hydrogens Ha and HM are those indicated in the spectrum. Would you be able to draw the tree for Hx?
13C nuclear magnetic resonance
The nuclear magnetic resonance of 13C is complementary to that of 1H. The latter technique is used to deduce the structure of the carbon skeleton by observing the magnetic environments of hydrogen atoms, while 13C NMR spectroscopy determines the magnetic environment of carbon atoms.
The chemical shifts of carbon are 15 to 20 times greater than those of hydrogen because carbon is directly attached to the atoms that happen to be either shielding or unshielding. For example, the proton of an aldehyde absorbs at 9.4 ppm in the 1H spectrum while the carbonyl carbon absorbs at 180 ppm in the 13C spectrum.
Furthermore, the signals in the 13C spectrum are vertical lines, that is, there are no spin-spin splits. This is because only 1% of the carbon atoms enter resonance, and therefore there is a very small probability that a 13C nucleus is adjacent to another 13C nucleus.
A table of approximate values of chemical shifts in a 13C nuclear magnetic resonance spectrum is given below:


Recommended references to expand the search:
1. Aga Fano SA Emission Spectroscopy. (Accessed September 10, 2007). http://hiq.aga.com.co/International/Web/LG/CO/likelgspgco.nsf/DocByAlias/anal_icp .
2. Alonso, P. et al. chemistry Cou..Ed. McGraw-Hill. 1990.
3. Álvarez Jiménez, MD and Gómez del Río, MI Didactic Guide Analytical Chemistry II. UNED. 1999.
4. Arrivals Jimeno Siro; Burriel Barcelo Fernando; Hernandez Mendez Jesus; Lucena Count Felipe. Qualitative Analytical Chemistry. ISBN: 8497321405. ISB. 2006.
5. Ayres, Gilbert H. Quantitative Chemical Analysis. Editions of the Castle, 4th ed . ISBN: 8421902806. 1981.
6. Bermejo Barrera. M del Pilar. General, quantitative and instrumental analytical chemistry. Editorial Paraninfo. 7th Edition. ISBN: 8428318093. 1990.
7. Blanco, M., Cerdá, V. and Sanz Medel, A., Analytical Atomic Spectroscopy, University Publications Autonomous of Barcelona. 1990.
8. Brode. RW, Chemical spectroscopy, New York 1952.
9. Burriel, MF, Lucena, CF. Quantitative Analytical Chemistry. Revolutionary Edition. Havana.1978.
10. Burriel, F. Qualitative Analytical Chemistry. Editorial Paraninfo. ISBN: 8497321405. pp 1072. , 2003.