infrared spectroscopy
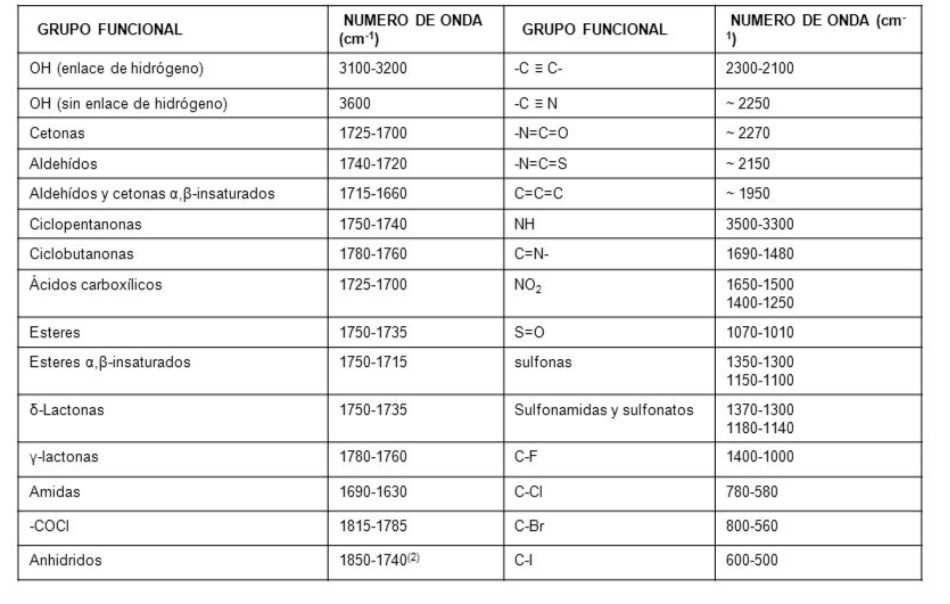
Infrared spectrometry is extremely useful for qualitative determinations of organic compounds and for deducing molecular structures from their functional groups of both organic and inorganic compounds.
In qualitative analysis infrared spectroscopy can be used for the identification of pure substances or for the absorption, localization and identification of impurities.
To locate an impurity in a substance, a comparison is made between the spectrum of the substance being studied and a sample of the pure substance. Impurities cause additional absorption bands to appear in the spectrum.
In the IR they are also finding increasing use in quantitative analysis, the main field of application of this type of analysis is in the quantification of atmospheric pollutants that come from industrial processes.
A part of the electromagnetic spectrum that extends from 0.8 to 1000μm (which corresponds to the wave number between 12800 and 10 cm-1), is considered as the infrared region which is divided into three regions called:
a).- IR Near. b).- Fundamental or Medium IR c).- Far IR
Each type of bond absorbs infrared radiation at a different frequency, which makes it possible to determine what type of functional groups the molecule under study has. Infrared spectrophotometers work in the mid-infrared and scan from 4000 c m − 1 to 400 c m − 1
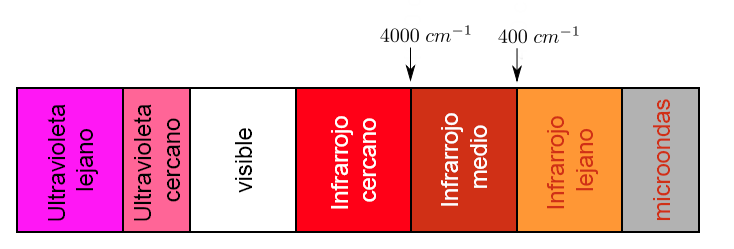
However, the region of analytical importance is the Fundamental IR region since most infrared instruments cover this region.
Most organic and inorganic materials demonstrate absorption and the spectrum is caused primarily by vibrational stretching and bending within the molecule. The infrared spectrum is one of the most characteristic properties of a compound since there are no two identical spectra for two different compounds, it is like a fingerprint.
Within the Fundamental IR region there are two regions, one of them is the so-called
the functional groups from 4000cm-1 to 1300 cm-1, and the finger region from 1300 cm-1 to 670cm-1.
In the region of the functional groups, the position of the absorption peak is higher or lower depending only on the functional group where the absorption arrives and not on the complete molecular structure. The position of the peaks in the finger region are dependent on the complete molecular structure.
Characteristics that a vibration must have to produce an absorption band:
The incident radiation must have a frequency equal to the frequency of the vibration it is going to produce.
That the resulting vibration produces a change in the dipole moment, that is, the vibration will not absorb infrared radiation, if there is no change in the dipole moment it is called inactive vibration and they will be active when there is said change in the dipole moment.
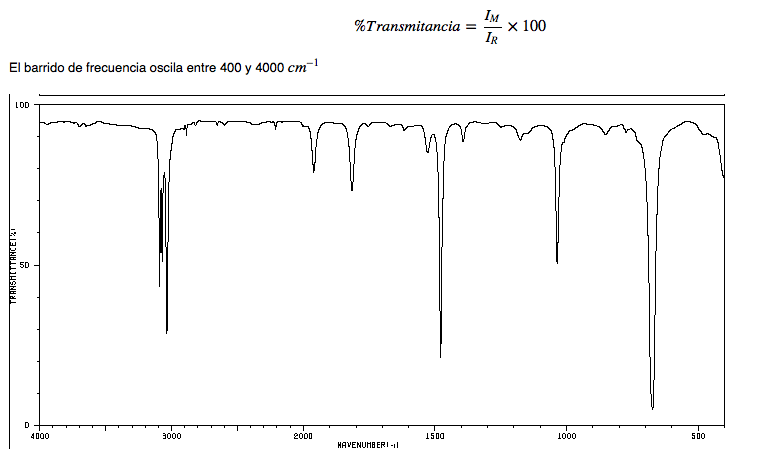
Traditionally, the x-axis of infrared spectra uses the number of waves ( ν ¯ , read "nu bar"') and is defined as the inverse of the wavelength in cm. ν ¯ = 1 λ . The y-axis represents the percentage of transmitted radiation (transmittance) which is represented by % T . The shape of the infrared spectrum of hexane is shown below.
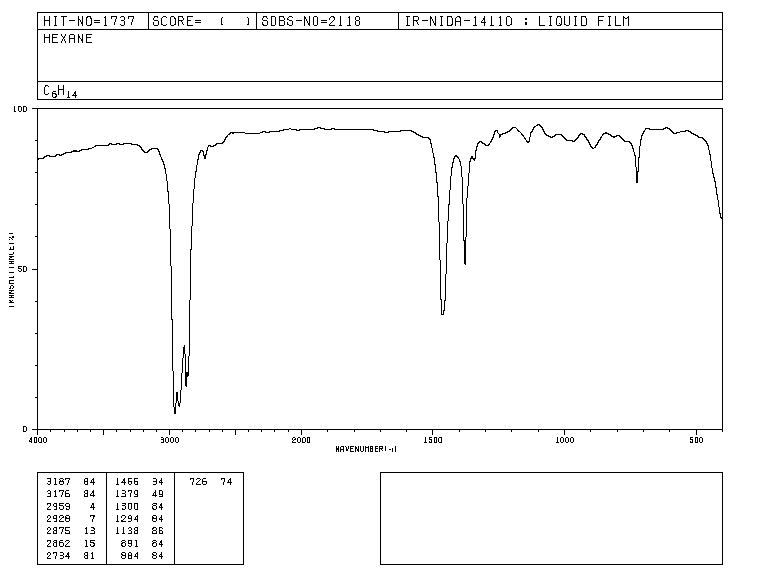
The bands represent areas where the bonds of the molecule absorb infrared radiation. In the bands the transmittance is small and the absorbance is large.
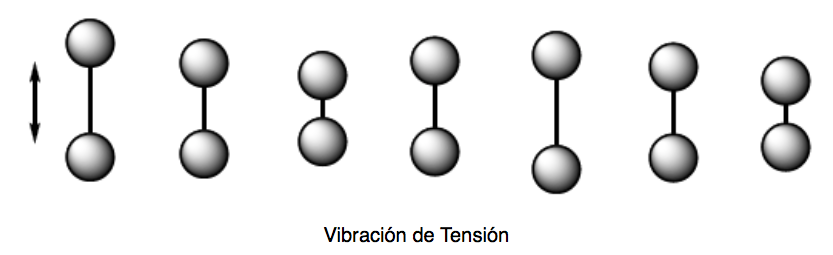
types of vibration
Tension vibration (stretching). Atoms held together by single, double, or triple bonds move toward and away in the direction of the bond, just as two masses attached to a spring oscillate.
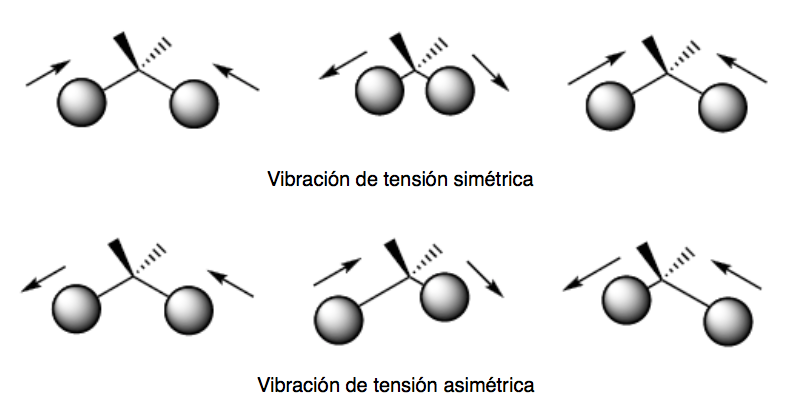
There are two modes of tension vibration: symmetric and asymmetric.
bending vibration. The atoms vibrate so that the angles vary, but the bond lengths do not. There are four modes of bending vibrations: scissoring, rocking, wagging, and twisting.
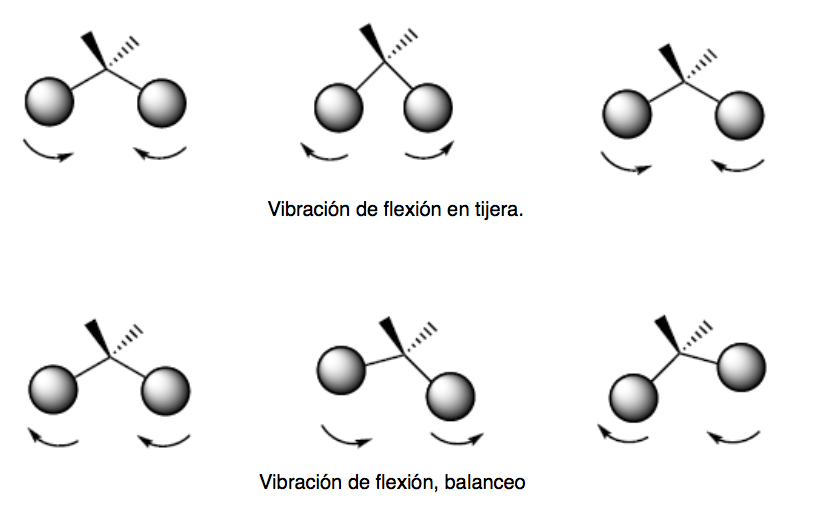
These two modes of vibration take place in the plane that contains the three atoms that participate in the vibration.
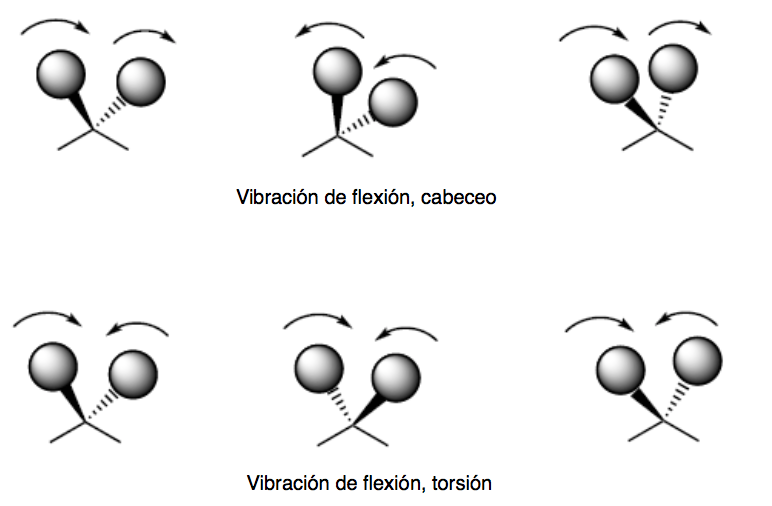
The pitch and torsion modes of vibration occur out of plane (Out of plane) and are usually represented by Oop.
quantum harmonic oscillator
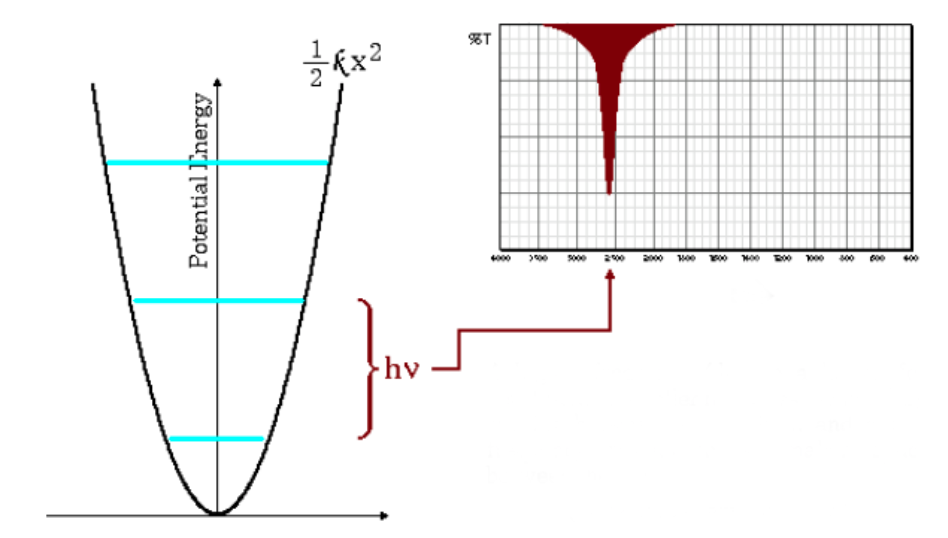
Molecular vibrations can be studied with the quantum harmonic oscillator model. The energy is given by:
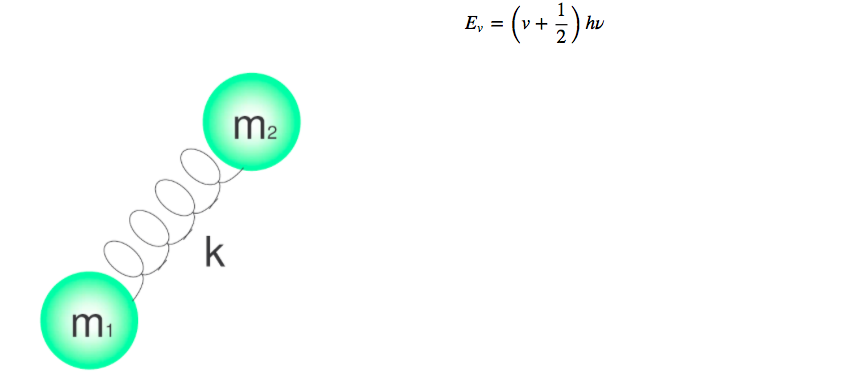
The different energy levels are given by the quantum number v, which takes values 0.1.2.3.4.....
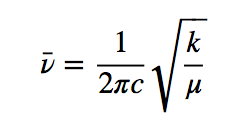
h is Planck's constant and ν is the frequency of the oscillator that is given by the expression:
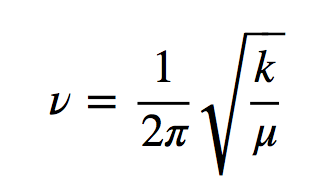
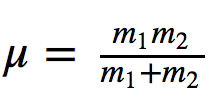
where k is the force constant of the spring and μ the reduced mass of the system
Dividing the frequency by the speed of light gives number of waves ν ¯
The above equation indicates that small reduced masses (low mass atoms) and high force constants (strong bonds) lead to high frequencies. Under these conditions the absorption bands emerge at high wavenumbers.
As can be seen in the graph, high frequencies give rise to a greater spacing between energy levels.
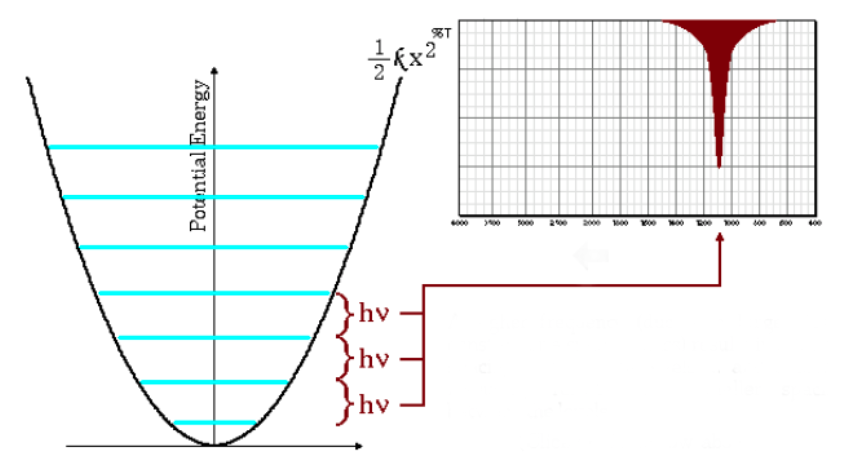
Low absorption frequencies
The above equation also indicates that large reduced masses and small force constants (weak bonds) lead to low frequencies. Under these conditions the absorption bands come out at low wave numbers.
As can be seen in the graph, low frequencies give rise to less spacing between energy levels.
Main molecular vibrations
IR spectrum
In an infrared spectrum, frequency (in wavenumber) is plotted against the percentage of light transmitted (transmittance). The transmittance percentage is defined as the quotient between the intensity of the light transmitted through the sample, I M , and the intensity of the light of the reference beam I R multiplied by 100.
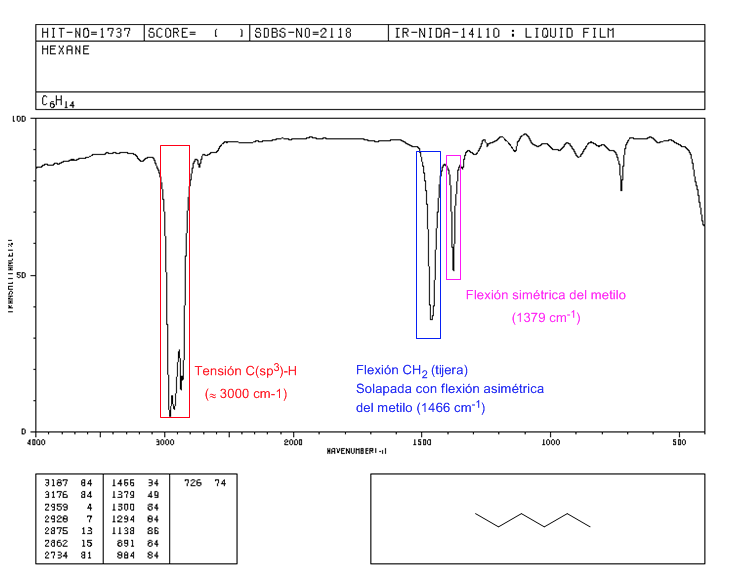
IR spectrum of alkanes
• CH strain: alkanes exhibit CH strain vibrations slightly below 3000 c m − 1
• CH bending: the CH 2 of the chain show bending vibrations (scissors) at 1465 c m − 1 , while the methyls produce a band at 1375 c m − 1 due to symmetric bending vibration and another at 1450 c m − 1 due to asymmetric bending vibration. All push-up bands are medium intensity.
Note that the asymmetric bending band of methyl overlaps with the scissor bending band of CH 2 .
IR spectrum of hexane
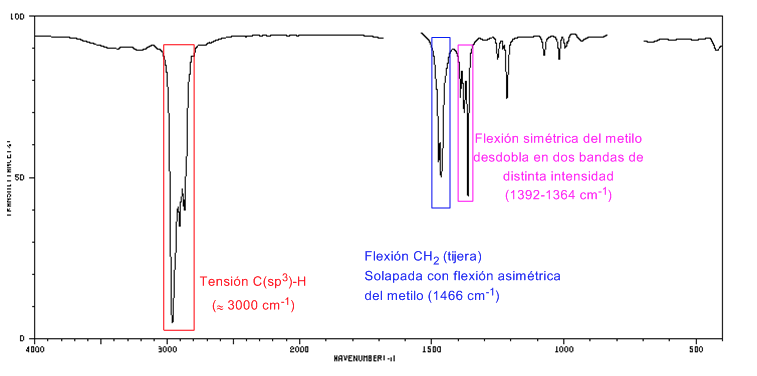
Spectrum of 2,2-dimethylbutane
The presence of the tert-butyl group produces the splitting of the symmetric bending band into two bands at 1390 and 1370 c m − 1 . The band at 1390 is half as strong as that at 1370.
IR spectrum of cycloalkanes
Cycloalkanes have an IR spectrum very similar to alkanes with a CH stretch band slightly below 3000 c m − 1 and a CH flexure band in scissors for CH 2 at 1465 c m − 1 . The main difference with alkanes is the absence of the symmetrical stretch band of methyl. 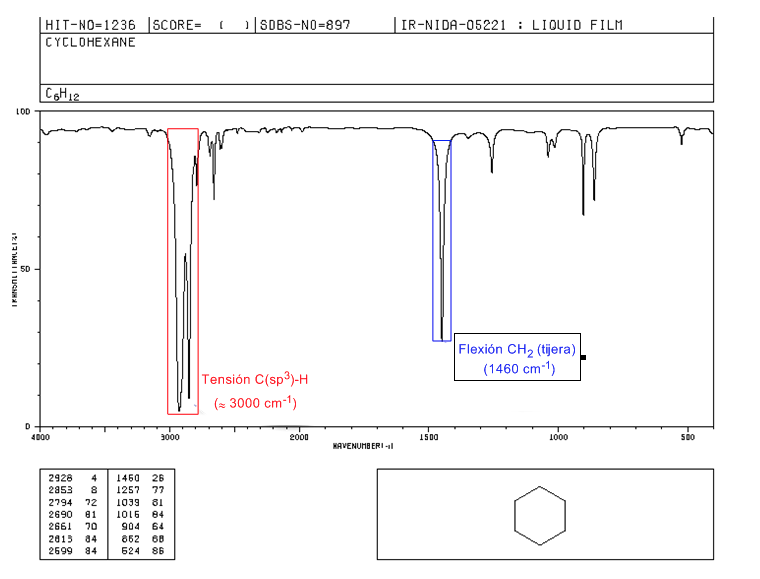
Note the absence of the methyl symmetric bending band that alkanes present at 1375 c m − 1 .
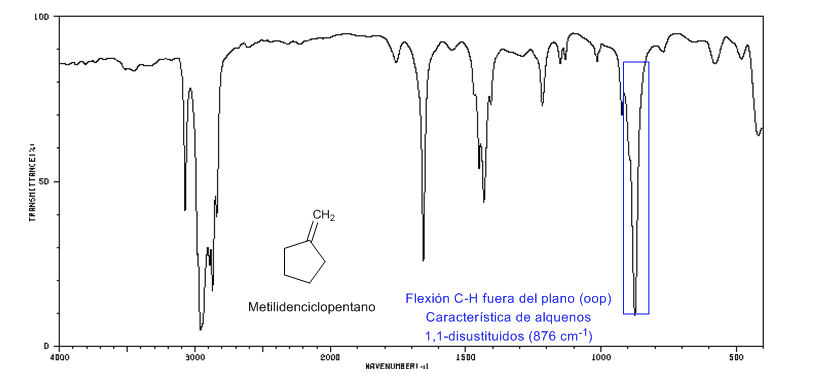
IR spectrum of alkenes
• Tension C(sp2)-H: 3100 -3000 cm-1
• Tension C=C: 1600 cm-1
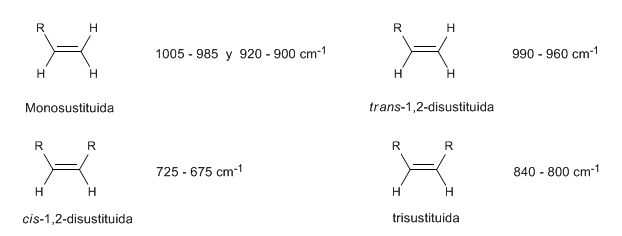
• Out-of-plane bending (oop) of the C=CH bond: 1000 - 650 cm-1. This type of band allows to know the degree of substitution of the alkene.
Spectrum of 1-pentene
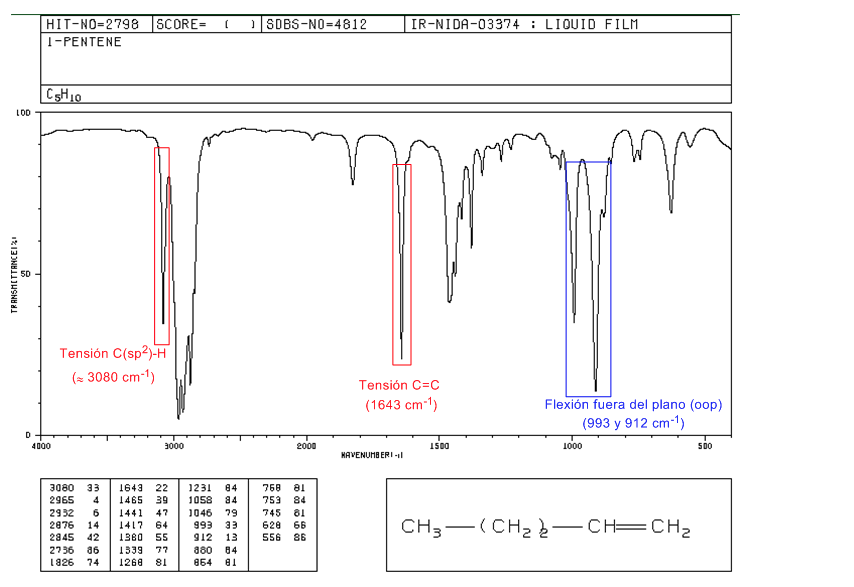
In monosubstituted alkenes, such as 1-pentene, out-of-plane CH bends produce two bands located at 1005-985 and 920-900 c m − 1 .
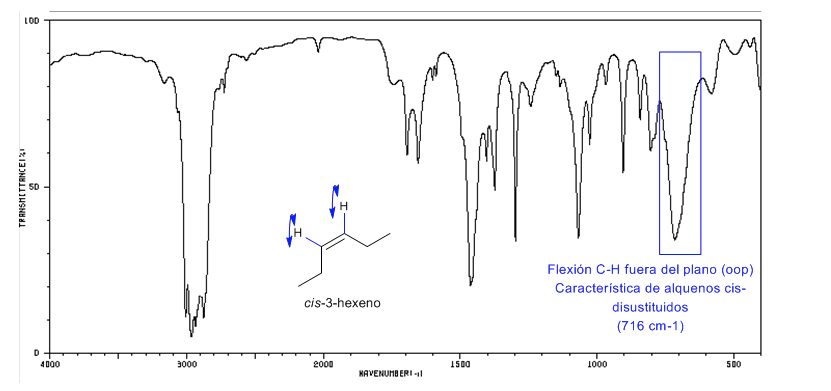
Stereochemistry and IR spectroscopy of alkenes
Cis-disubstituted alkenes present an out-of-plane CH bending band that allows them to be distinguished. This band appears between 725-675 c m − 1
Spectrum of Cis-3-hexene
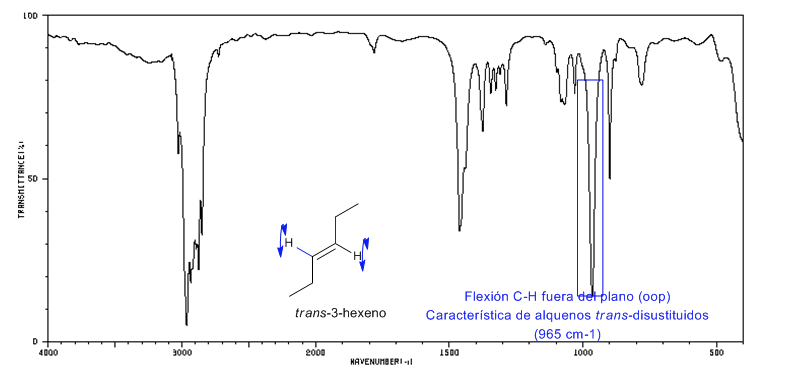
Spectrum of Trans-3-hexene
The trans-disubstituted alkenes present a strong absorption band between 980-965 c m − 1 that allows their identification. Note the total absence of the C=C tension band at 1600 c m − 1 due to the lack of polarity.
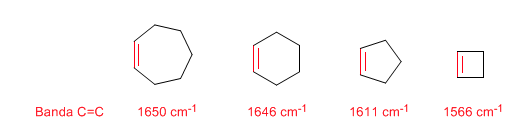
Ring Strain: Endocyclic C=C Bonds
As the size of the ring decreases, the tension band of the C=C bonds moves towards a smaller number of waves. The exception of cyclopropene is attributed to the coupling between the tension vibrations of the C=C and CC bonds. This coupling does not occur in cyclobutene because the C=C and CC bonds are perpendicular to each other.
 IR spectrum of cyclopentene
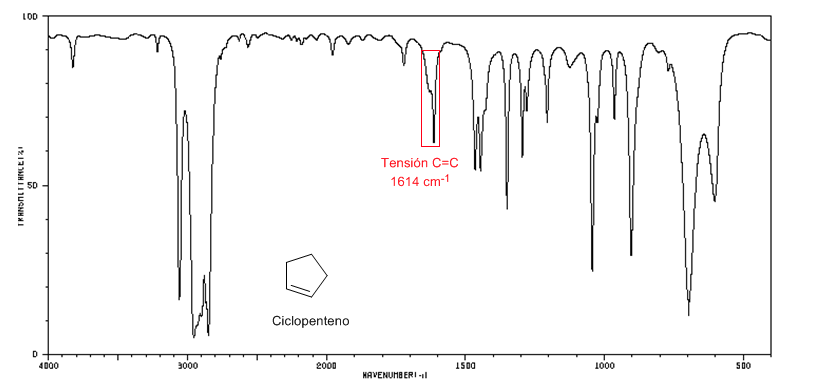
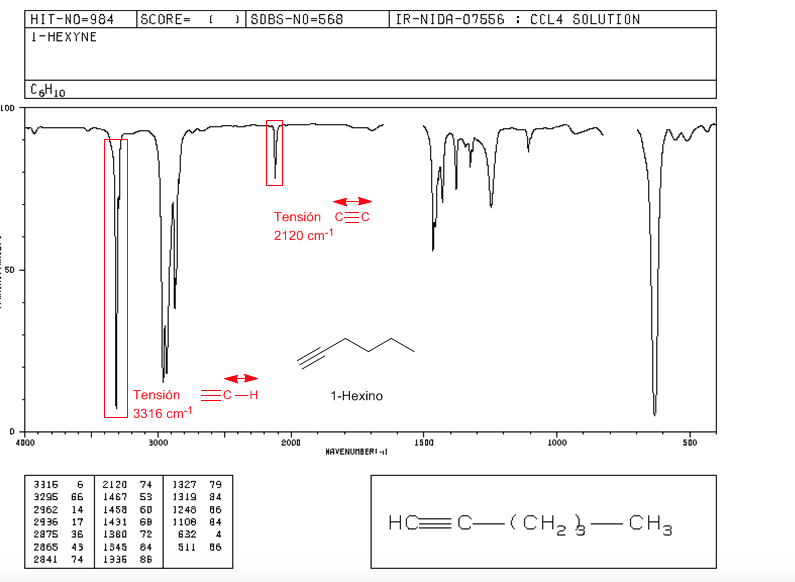
Tension ≡ C − H : 3300 c m − 1
Tension − C ≡ C − : 2150 c m − 1 . Symmetrical alkynes do not present this band, being very weak in the internal ones. The conjugation lowers the value slightly.
spectrum of 1-hexine
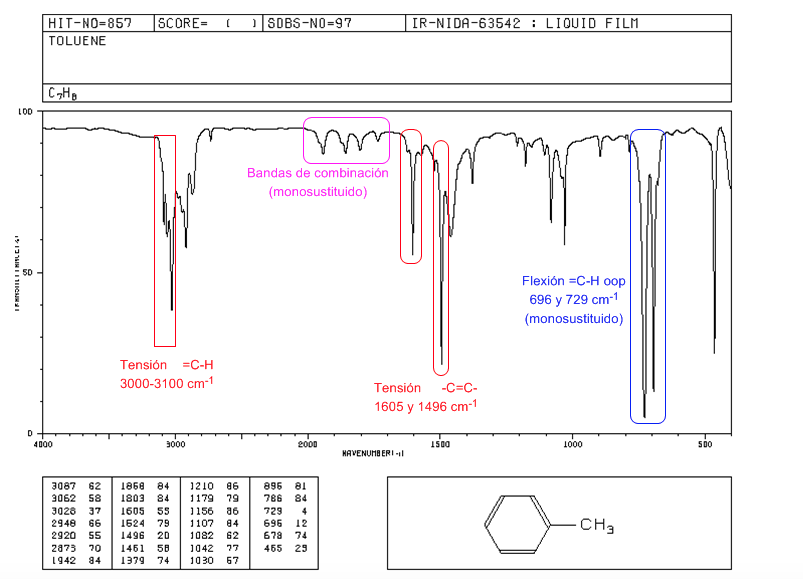
IR spectrum of aromatics
Tension =CH: 3100 cm-1
Tension -C=C-: 1600 and 1475 cm-1
Flexion =CH out of plane: 900-690 cm-1
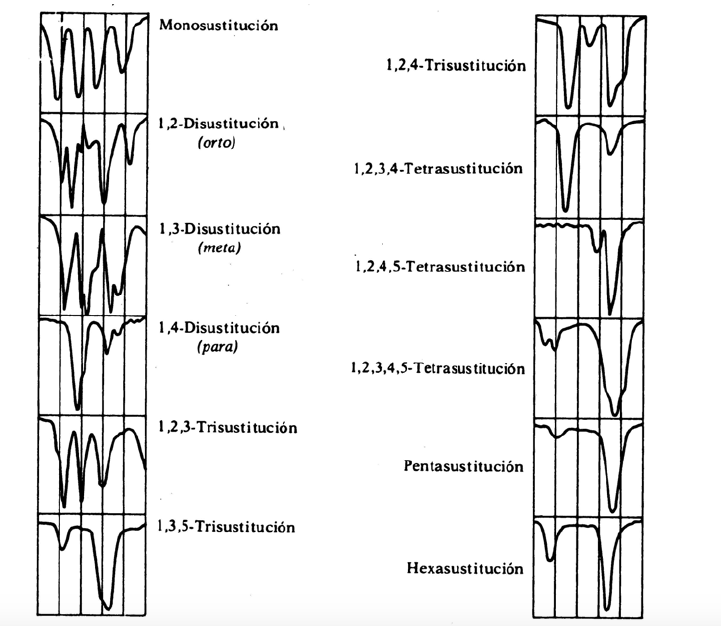
The oop vibrations together with the overtones and combination bands that appear between 2000 and 1667 cm-1 allow us to know the degree of substitution of benzene.
replacement bands
![]()
Spectra of alcohols and phenols
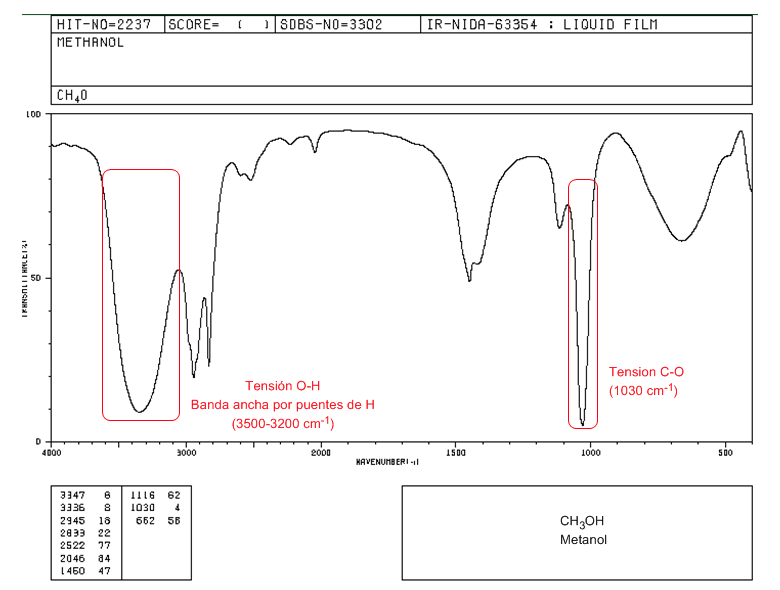
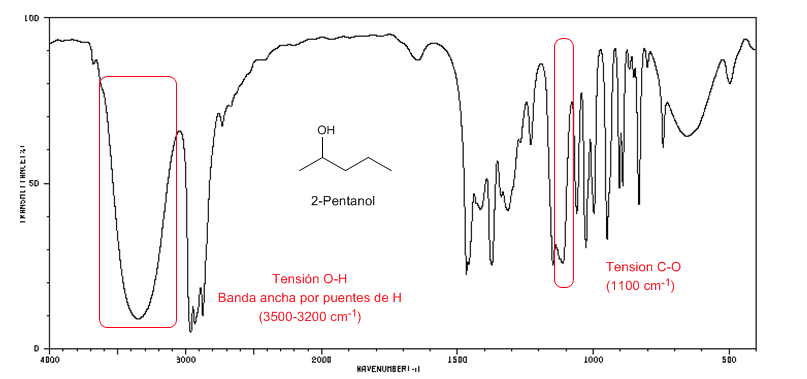
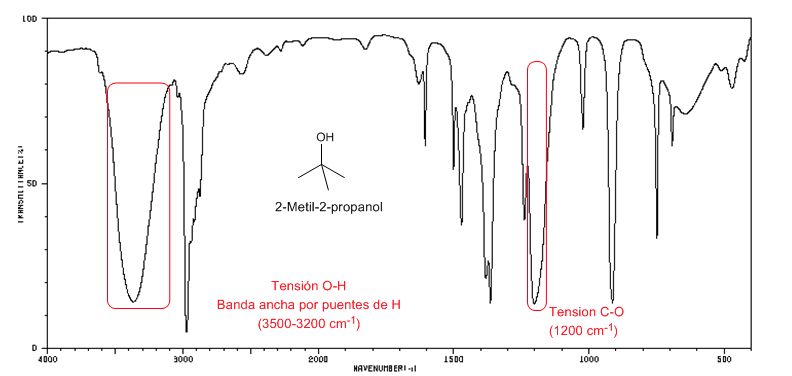
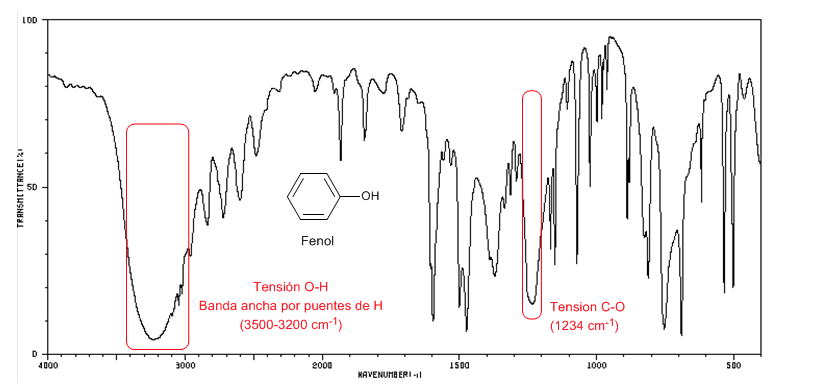
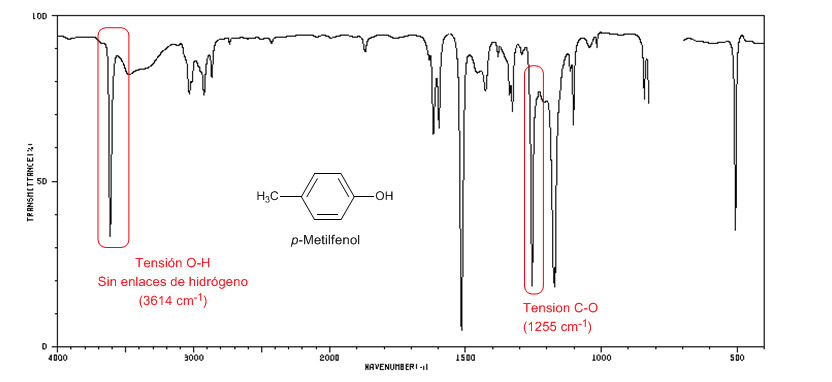
OH tension: Broad band from 3500 to 3200 cm-1. In the absence of hydrogen bonding, it appears as a sharp peak at 3650-3600 cm-1.
CO tension: Band between 1250-1000 cm-1. It allows distinguishing between primary (1050 cm-1), secondary (1100 cm-1), tertiary (1150 cm-1) and phenols (1220 cm-1) alcohols.
IR spectrum of a primary alcohol (methanol)
In the spectrum of methanol we can observe the very wide OH tension band, due to the formation of hydrogen bonds. The CO tension band comes out at a low wave number (1030) because it is an alcohol without substituents.
IR spectrum of secondary alcohols (2-pentanol)
Observe the displacement of the CO band towards a greater number of waves with respect to methanol.
 IR spectrum of tertiary alcohols ( 2-methyl-2-propanol)
Tertiary alcohols have the CO band shifted to higher frequencies than primary and secondary alcohols.
Phenol presents a CO absorption band above 1200 cm-1
The following spectrum shows the OH stretch band in the absence of hydrogen bonding.
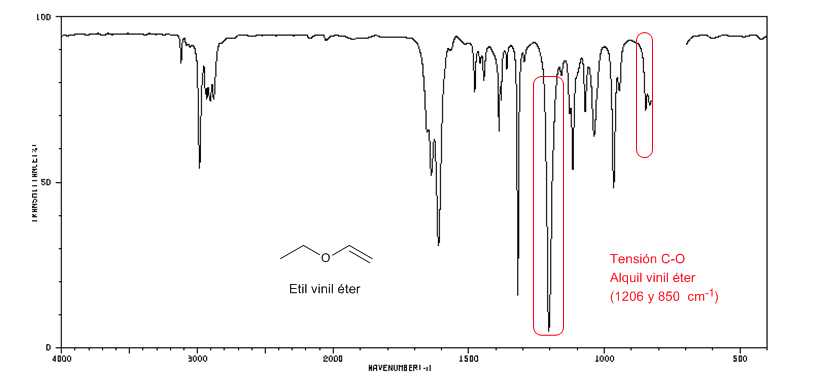
The alkyl vinyl ethers (CH2=CH-OR) present two bands at 1220 and 850 cm-1. The latter very weak.
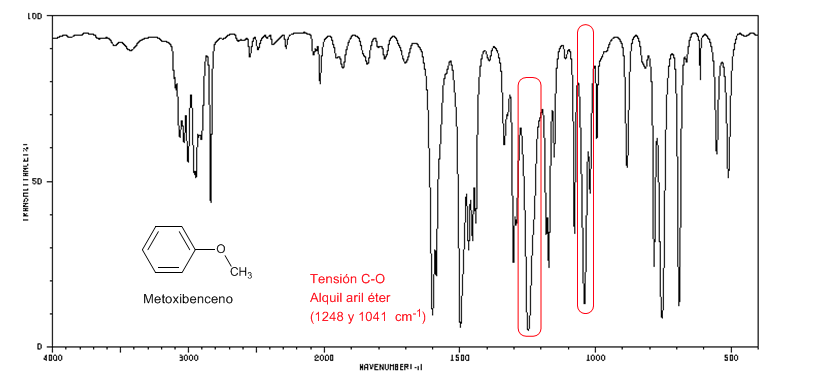
The aryl alkyl ethers (Ar-OR) present two bands at 1250 and 1040 cm-1
IR spectrum of 1-methoxyhexane
Ethyl vinyl ether presents two bands at 1220 and 850 cm-1. The latter is very weak.
Methoxybenzene presents two bands at 1250 and 1040 cm-1
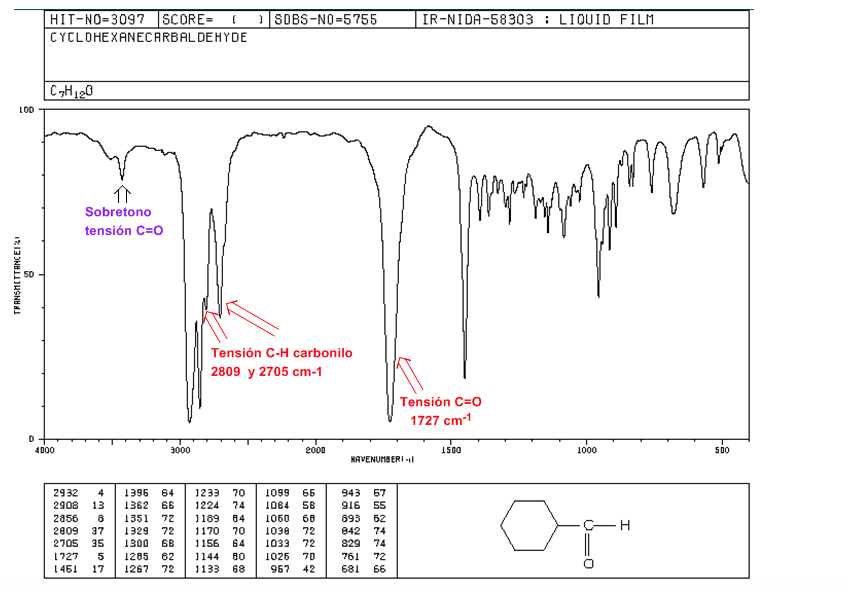
aldehydes
C=O tension: 1725 cm-1
CH carbonyl strain: two weak bands at 2850 and 2750 cm-1. The band at 2850 tends to overlap with that of tension C(sp3)-H
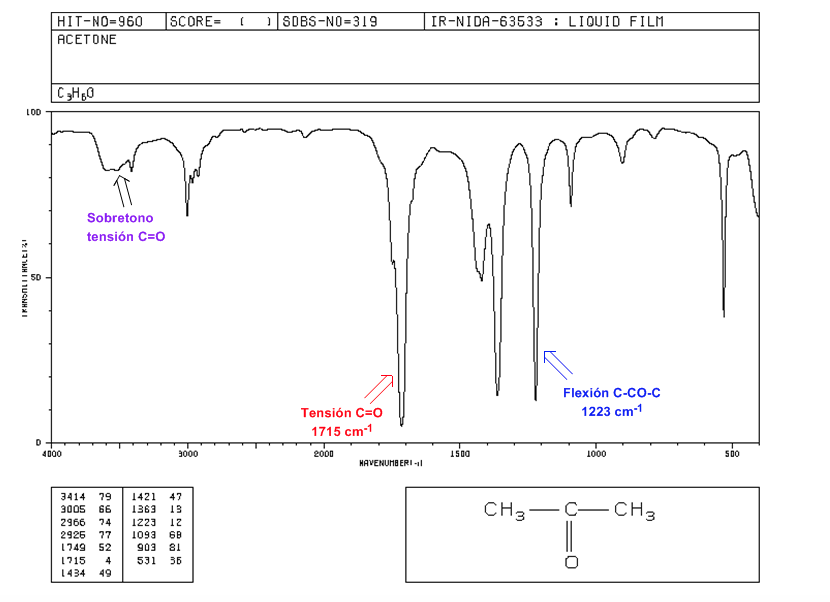
C=O Voltage Overtone over 3500 cm-1.
C=O tension: Intense band at 1715 cm-1.
Flexion C-CO-C: 1300 - 1100 cm-1.
C=O voltage overtone: from 3500 to 3350 cm-1.
Effect of conjugation on the C=O Tension band
IR spectrum of carboxylic acids and derivatives
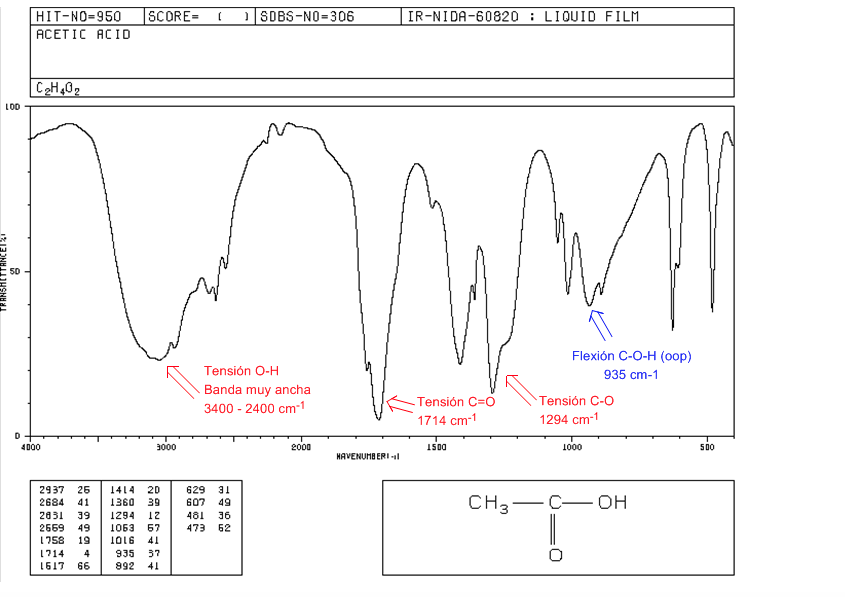
Carboxylic acids
OH tension: From 3400 to 2400 cm-1. Very wide due to the formation of hydrogen bonds.
C=O tension: 1730-1700 cm-1
CO tension: 1320-1200 cm-1
COH Flexion (oop): Bell-shaped band at 900 cm-1
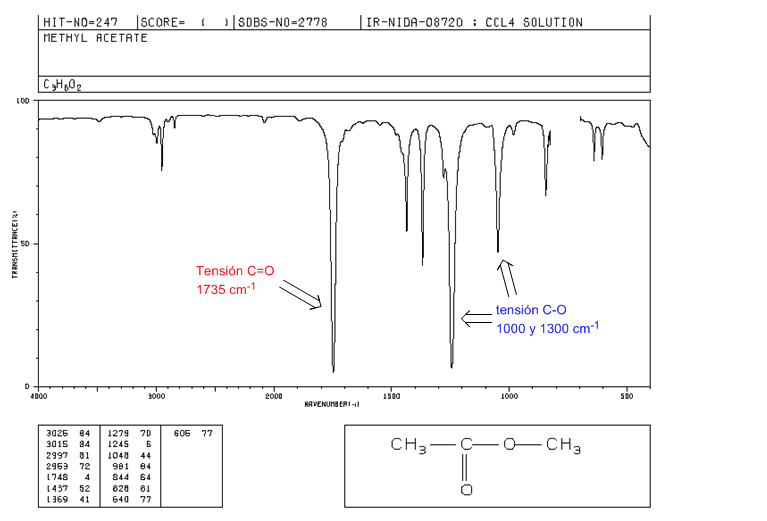
esters
C=O tension at 1735 cm-1. If there are conjugated double bonds with the carbonyl, the band shifts to lower values. When the double bond is on the alkoxy group (-OR) of the ester, a shift towards higher values is observed.
CO tension: 2 bands at 1300 and 1000 cm-1. Being wider and more intense the one observed at 1300.
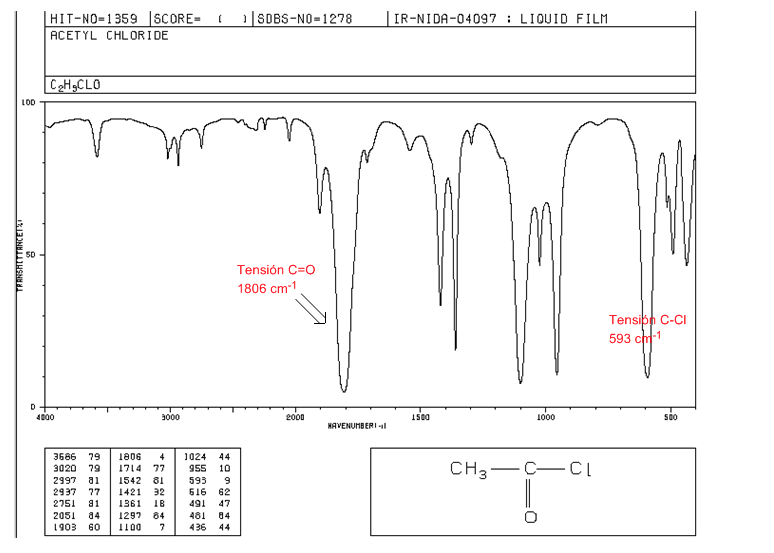
acid halides
C=O tension: 1810 - 1775 cm-1
C-Cl tension: intense band 730 - 550 cm-1
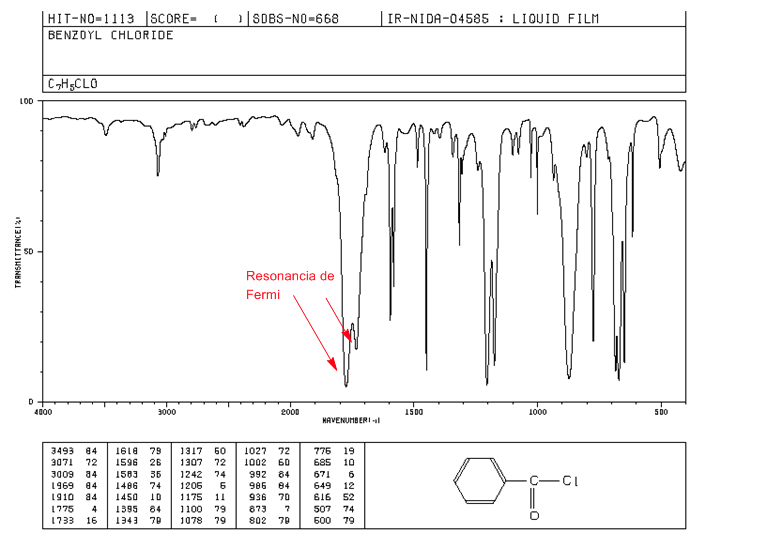
Fermi resonance
Overtones are vibrational transitions from the ground state to higher excited states. The absorption frequencies are being the frequency of the fundamental absorption. Fermi resonance , result from the coupling of a fundamental absorption band with an overtone or a combination band.
Aromatic alkanoyl halides exhibit two C=O strain bands by Fermi resonance.
 Nitriles
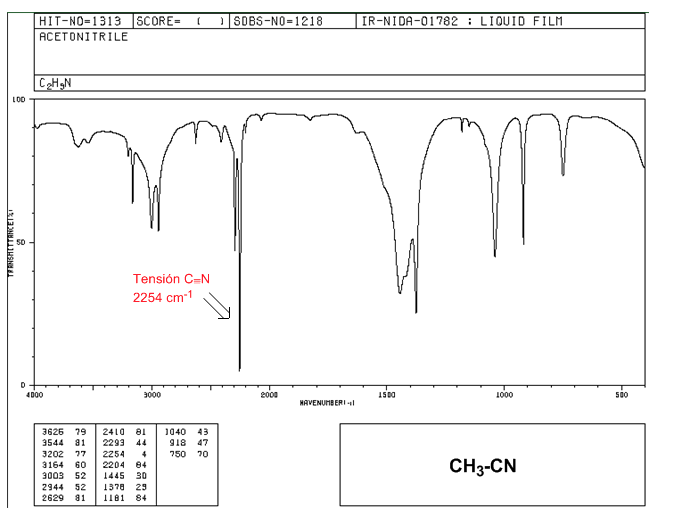
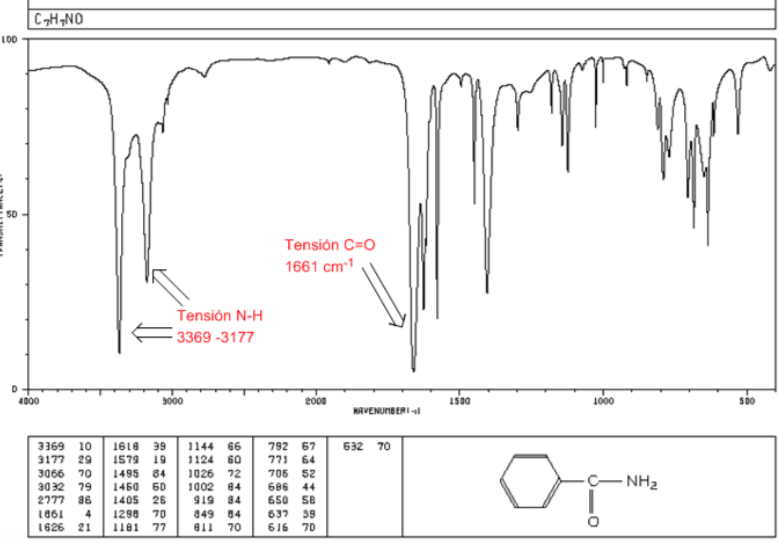
amides
C=O tension: 1680 - 1630 cm-1
NH tension: Between 3350 and 3180 cm-1. Primary amides have two bands, while secondary amides have only one band.
Flexion NH: 1640 - 1550 cm-1
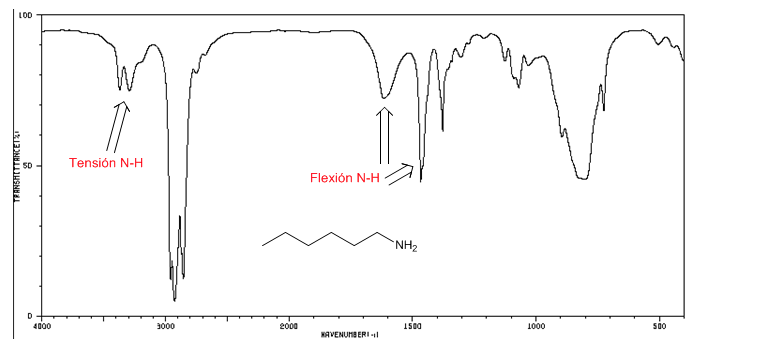
IR spectrum of amines
NH tension: between 3500 and 3300 cm-1. The primary amines present two bands (symmetric and asymmetric), the secondary ones only one band.
NH bending: Primary amines two bands at 1640 and 1560 cm-1. Secondaries a band at 1500 cm-1
IR spectrum of 1-hexane-amine
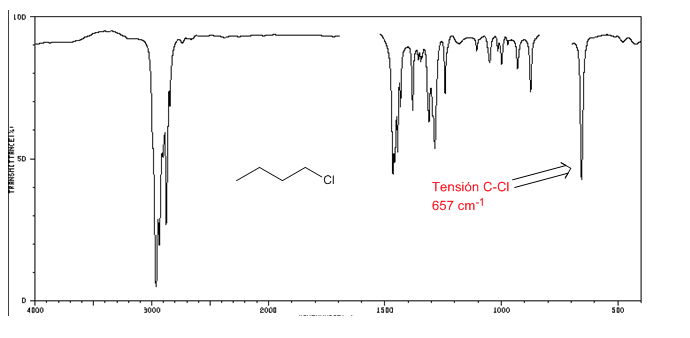
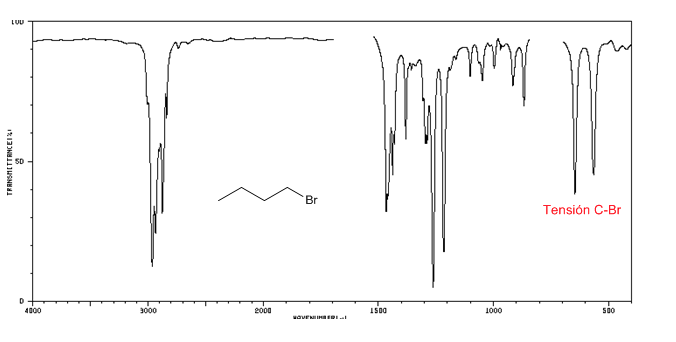
IR spectrum of alkyl halides
C-Cl tension: 785 - 540 cm-1
Ension C-Br: 650 - 510 cm-1
 Recommended sources to expand the search:
1. Aga Fano SA Emission Spectroscopy. (Accessed September 10, 2007). http://hiq.aga.com.co/International/Web/LG/CO/likelgspgco.nsf/DocByAlias/anal_icp .
2. Alonso, P. et al. chemistry Cou..Ed. McGraw-Hill. 1990.
3. Álvarez Jiménez, MD and Gómez del Río, MI Didactic Guide Analytical Chemistry II. UNED. 1999.
4. Arrivals Jimeno Siro; Burriel Barcelo Fernando; Hernandez Mendez Jesus; Lucena Count Felipe. Qualitative Analytical Chemistry. ISBN: 8497321405. ISB. 2006.
5. Ayres, Gilbert H. Quantitative Chemical Analysis. Editions of the Castle, 4th ed . ISBN: 8421902806. 1981.
6. Bermejo Barrera. M del Pilar. General, quantitative and instrumental analytical chemistry. Editorial Paraninfo. 7th Edition. ISBN: 8428318093. 1990.
7. Blanco, M., Cerdá, V. and Sanz Medel, A., Analytical Atomic Spectroscopy, Publications of the Autonomous University of Barcelona. 1990.
8. Brode. RW, Chemical spectroscopy, New York 1952.
9. Burriel, MF, Lucena, CF. Quantitative Analytical Chemistry. Revolutionary Edition. Havana.1978.
10. Burriel, F. Qualitative Analytical Chemistry. Editorial Paraninfo. ISBN: 8497321405. pp 1072. , 2003.